Looking for the best tally mark worksheets on the internet? We have exactly what you need! Our tally mark worksheets are the perfect combination of fun and learning. With our free worksheets, your students will be able to practice counting, addition, and subtraction with ease. Our tally mark worksheets can help kids learn in a creative way. Plus, they’re easy to print and use right away! So don't wait any longer - get your hands on our free tally mark worksheets today and make math fun!
Browse Sheets By Problem Type
×

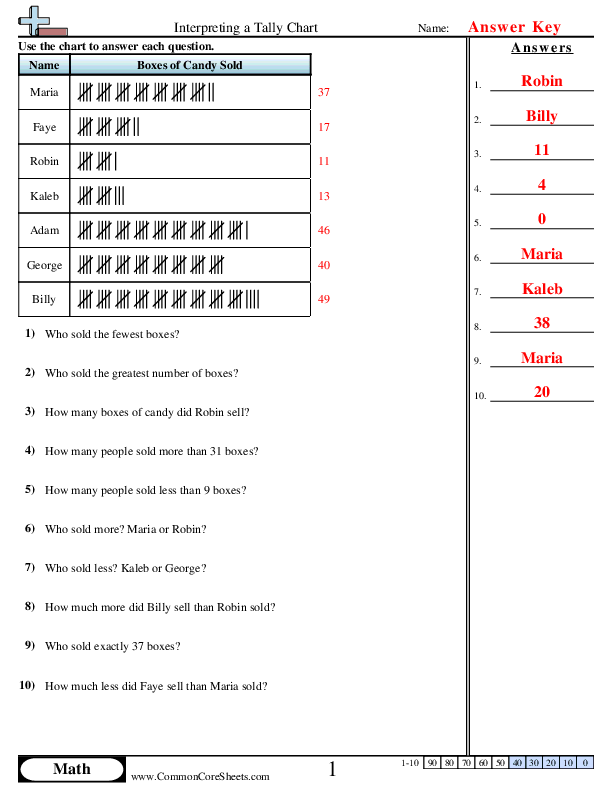
Interpreting a Tally Graph


×
Description:
"This worksheet is designed for children to practice math through interpreting tally charts. It includes 10 problems, such as determining the weeks with the highest and lowest toy sales, specific weekly sales, and comparisons between weeks. This interactive resource can be customized to fit individual learning needs, converted into flashcards for different study approaches, or utilized in distance learning environments to enhance remote education."

×
Student Goals:
Understanding Tally ChartsStudents will gain a strong comprehension of tally charts, learning how to interpret information presented in this format. This will imbue them with essential skills to analyze and make sense of data in visual representations, especially in mathematical situations involving mass data accumulated over time.Critical ThinkingBy tackling problems that require students to identify highest, lowest, and specific data points, they will enhance their critical thinking capacities. They will learn to analyze, compare and contrast data, forming conclusions from the provided information. This ability is particularly significant in numerous areas of education and daily life.Mathematical SkillsIn navigating through these problems, students will enhance their competencies in basic mathematical operations. They will perform calculations involving subtraction to determine the difference in toys sold in different weeks. This reinforces their understanding of key mathematical concepts and their instantaneous application.Problem Solving AbilitiesStudents will enhance their problem-solving abilities by interpreting tally chart information to answer the problems. They will gain experience in seeking relevant information, making accurate interpretations and coming up with accurate answers — an important skill not only acadically, but also in day-to-day life management.Data InterpretationThrough analyzing the given data, students will develop their data interpretation skills. They will understand how change in one area (week) affects the others, helping them to connect similar situations with real-life scenarios. Data interpretation is an essential problem-solving skill in many fields like science, technology, and business.Attention to DetailWorking on these problems, students will learn to pay close attention to detail. Each question requires careful examination of the tally chart to ensure correctness of responses. This skill can be applied in various disciplines and scenarios, helping to minimize errors and heighten precision in task execution.


Matching Tally to Bar Graph


×
Description:
"This worksheet is designed to enhance children's proficiency in math, through solving six problems on matching tally to bar graphs. Customizable for specific learning objectives, it uses examples featuring names and the number of cans recycled to facilitate understanding. Adaptable as flash cards for interactive engagement, it is equally suited for distance learning environments, promoting continuous, self-paced mathematical development."

×
Student Goals:
Understanding Bar GraphsUpon completion of the Match Tally to Bar Graphs worksheet, students will have developed a foundational understanding of bar graphs. They will be capable of decoding information represented in this visual form, a skill that is often required in subsequent math topics and even in other subjects. This understanding will also enhance their data interpretation skills, a critical component of numeracy.Interpreting DataCorrectly interpreting data is a vital part of math and this skill will be significantly improved after completing the worksheet. By correlating names to cans recycled in the problems, students will obtain the ability to read data whether in tally marks or bar graphs. This will advance their ability to analyze and generalize from data, opening the gateway for more complex statistical concepts in the future.Problem-Solving SkillsThis worksheet will help students enhance their problem-solving skills. Having to match a tally to a corresponding bar graph requires critical thinking and analysis. It will challenge students to connect different but related pieces of information, a critical skill applicable not just in math but across various subjects and real-life situations.Mathematical CommunicationStudents will be better equipped to communicate numerically after completing the worksheet. The ability to change tally marks into bar graphs and vice versa will allow students to express numerical data in multiple ways. This is an essential part of mathematical literacy that is used throughout their entire education.Confidence with NumbersFinally, the successful completion of these problems will drive a boost in students' confidence when dealing with numbers. They will gain increased comfort with graphical representation of data, influencing their performance in subsequent mathematical endeavors and instilling in them a greater appreciation for the subject.


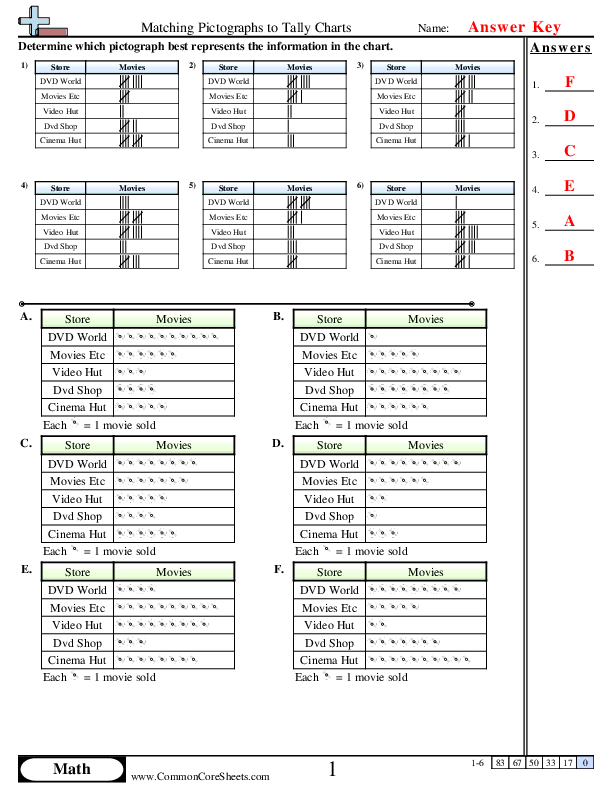
Matching Pictographs to Tally Charts


×
Description:
"This worksheet is designed to help children learn math through matching pictographs to tally charts. With a set of six interactive problems featuring different gamers and their games, kids develop basic analytical skills. Users can customize the worksheet for varying difficulty levels. Additionally, it can be converted into flashcards for easy learning or used in distance learning settings, catering to diverse educational needs and learning styles."

×
Student Goals:
Comprehension of Data RepresentationUpon the completion of the worksheet, students should be able to accurately comprehend the concept of data representation. They will have improved understanding of how to translate the presented data from tally charts to pictographs, and vice versa. This exercise will serve as a step towards statistically arranging and understanding larger quantities of data sets.Enhancement of Analytical SkillsThe exercises on this worksheet are designed to enhance the analytical skills of students. They will be better equipped to identify patterns, observe differences or similarities, and draw substantive conclusions from the data. This ability to dissect and understand numerical and graphical presentations of data will come in handy in various real-life applications and advanced mathematical problem-solving.Improved Interpretation and Prediction SkillsAfter completing this worksheet, students should be able to interpret and make predictions from data presented in tally charts or pictographs. They will learn to read the data and project potential outcomes based on the given information. This further sharpens their decision-making skills, as they can make accurate predictions based on the representation of past or current data.Understanding Data TranslationThis activity will enhance the students’ understanding of data translation between different visual representations. Understanding how information can shift from one format to another while retaining its essence is a critical thinking skill that will be honed through this activity. The aptitude to transform data representations will be a skill they can apply to various academic and life scenarios.Building Mathematical VocabularyIn the process of completing this worksheet, students will become familiar with the terms and symbols used in data representation, such as ‘tally’ in tally charts and ‘icon’ in pictographs. Through repeated usage, they will build a solid mathematical vocabulary that will be essential in their academic journey in mathematics.


Filling in Frequency Table from Tally Marks


×
Description:
"This worksheet is designed to enlighten children on the practical side of math – creating and filling frequency tables from tally marks. It features five problems from various real-life scenarios like walking minutes, distance from school, candy sales, jogged miles, and books read. The worksheet is adaptable to diverse teaching methods like customization, conversion into flashcards, or use in distance learning showcases its versatility in improving children's mathematical capacity."

×
Student Goals:
Fundamental Understanding of Tally Marks and Frequency TablesUpon completion of this worksheet, students should have a stronger understanding of tally marks and frequency tables. They should be able to visually comprehend and interpret tally marks, which are a simple and effective tool for counting and grouping items. This represents a foundational mathematical concept that transcends more complicated mathematical operations. Moreover, they should be able to construct, read, and interpret frequency tables from given tally marks. Frequency tables are vital in data representation and the basic principle of statistics, where data is grouped into categories and their frequencies or occurrences are recorded. Understanding frequency tables prepares the student for future statistical studies.Practical Application of Math SkillsIn addition to a deepened understanding of mathematical symbols, students will be able to apply these skills to real-life scenarios upon completing this worksheet. Whether counting the number of books read, miles jogged, or boxes of candy sold, these exercises enhance both their counting and analytical abilities. Learners are exposed to different situations that encourage them to apply the skills learned not merely for mathematical purposes but as a tool for everyday use.Enhanced Analytical SkillsStudents should be able to exhibit improved analytical capabilities after completing the worksheet. They should be able to process data, identify patterns, and make predictions based on the results. This critical thinking plays a crucial role in executing mathematical tasks, enhancing problem-solving and predictive abilities inherent in such tasks.Increased Confidence and ProficiencyCompleting this worksheet should also significantly enhance the students' confidence and proficiency levels in related math topics. Familiarity with these basic calculation methods forms a solid foundation for advanced mathematical processes, permitting the student to transition smoother to more complex mathematical situations. This increased confidence plays an integral role in their overall mathematical performance.Improved Accuracy and SpeedBy practicing tallying and frequency identification, students should become increasingly accurate and faster in their calculations. Repeated exposure and familiarity with the concept can enable them to easily identify the number of items a set of tally marks represent. Additionally, they should be able to quickly fill in frequency tables from given tally marks, improving their speed in mathematical reasoning, thereby enhancing their overall mathematical fluency.


