Sort By Grade
8ee5
Each worksheet has 2 problems comparing the measurements of a chart and table.
Version 1
Version 2
Version 3
Version 4
Version 5
Version 6
Version 7
Version 8
Version 9
Version 10
Grab 'em All
Create New Sheet
Each worksheet has 3 problems analying a table and equation to compare the rate of change.
Version 1
Version 2
Version 3
Version 4
Version 5
Version 6
Version 7
Version 8
Version 9
Version 10
Grab 'em All
Create New Sheet
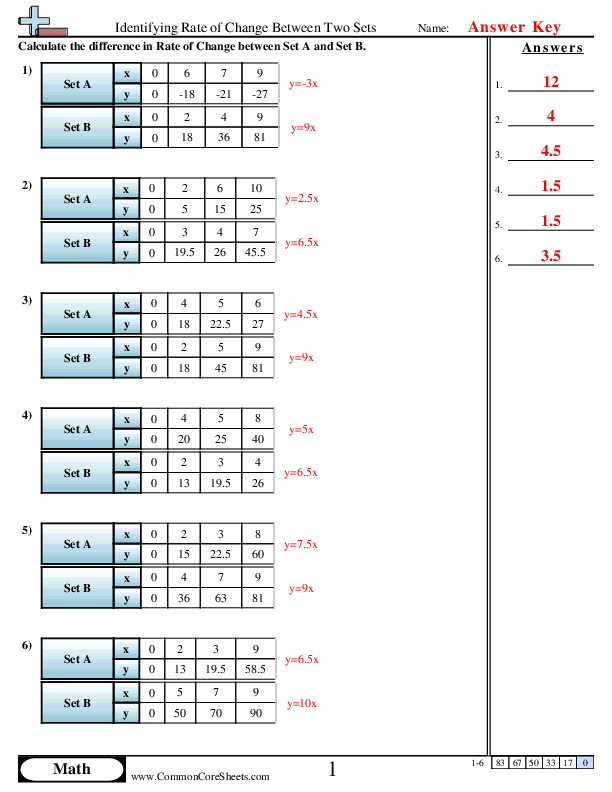
Each worksheet has 6 problems comparing the difference in rate of change between two sets.
Version 1
Version 2
Version 3
Version 4
Version 5
Version 6
Version 7
Version 8
Version 9
Version 10
Grab 'em All
Create New Sheet


