3md3 Worksheets
Measurement and Data
Represent and interpret data.
3Draw a scaled picture graph and a scaled bar graph to represent a data set with several categories. Solve one- and two-step ""how many more"" and ""how many less"" problems using information presented in scaled bar graphs. For example, draw a bar graph in which each square in the bar graph might represent 5 pets.
3md3

3md3


×
Description:
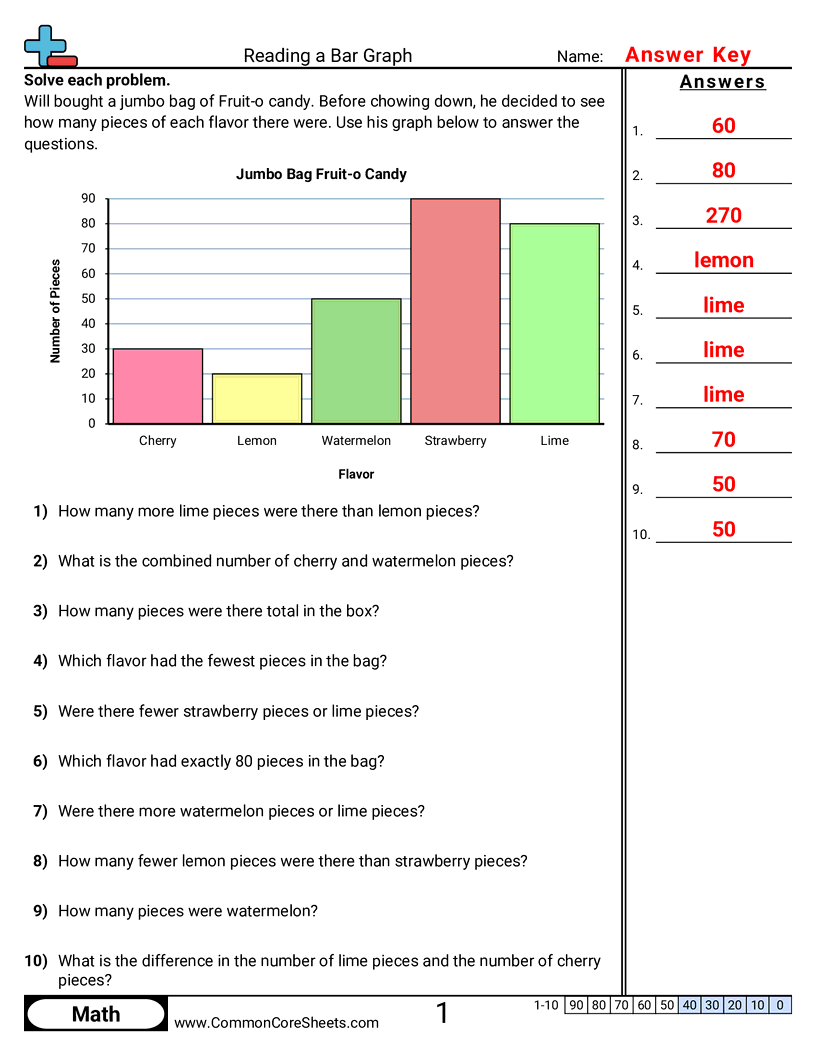
"This worksheet is designed to enhance children's understanding of bar graphs in math. It features 10 engaging problems where youngsters interpret data, compare figures, and analyze subject popularity based on student votes. Versatile and adaptable, it suits various learning approaches. Customize per your needs, convert into flashcards for hands-on learning, or integrate into any distance learning curriculum for a fruitful educational experience."

×
Student Goals:
Improved Data Interpretation SkillsStudents will develop the ability to interpret bar graphs. They would understand how to analyze the vertical or horizontal bars, representing the data in the graph, helping them to make comparative observations. This worksheet will lay down the foundation for data handling skills, which is a significant skill required in the real world.Enhanced Critical Thinking and Problem-Solving SkillsThe students will boost their problem-solving skills. Analyzing bar graphs and answering related questions requires strategizing and reasoning. They will become proficient in extracting and manipulating data from a given bar graph. Their critical thinking abilities will be enhanced, preparing them for higher-level mathematical challenges.Understanding of Mathematical ConceptsCompletion of this worksheet equips learners with a deeper understanding of fundamental mathematical concepts. For instance, they will be able to comprehend values, differences, and total number data points. They will also learn about concepts like most, least, and fewer, leading to a composed mental mathematical structure.Better Quantitative LiteracyThis worksheet will enrich students' numerical skills and overall quantitative literacy. Understanding number co-relations, working out differences between numbers, and determining total counts represented on a bar graph would help nurture their mathematical reasoning skills and quantitative aptitude.Skills in Comparative AnalysisStudents will learn how to make comparative analyses. They will examine and compare data from different sections of the bar graph, allowing them to draw accurate and rational conclusions. This is a skill that extends beyond mathematics, essential in other academic areas and life situations.Foster Curiosity and Enthusiasm for LearningBy offering a variety of problems, this worksheet will stoke the curiosity of students, encouraging a more profound interest in problem-solving. It fosters enthusiasm for learning as students enjoy the satisfaction of accurately interpreting data to solve problems.Increased Academic Performance and ConfidenceSolving such worksheets can lead to improvements in academic performance in the subject of Math. Additionally, as they become more adept at solving the problems within the worksheet, their confidence in handling similar problems in the future would be significantly boosted.


3md3


×
Description:
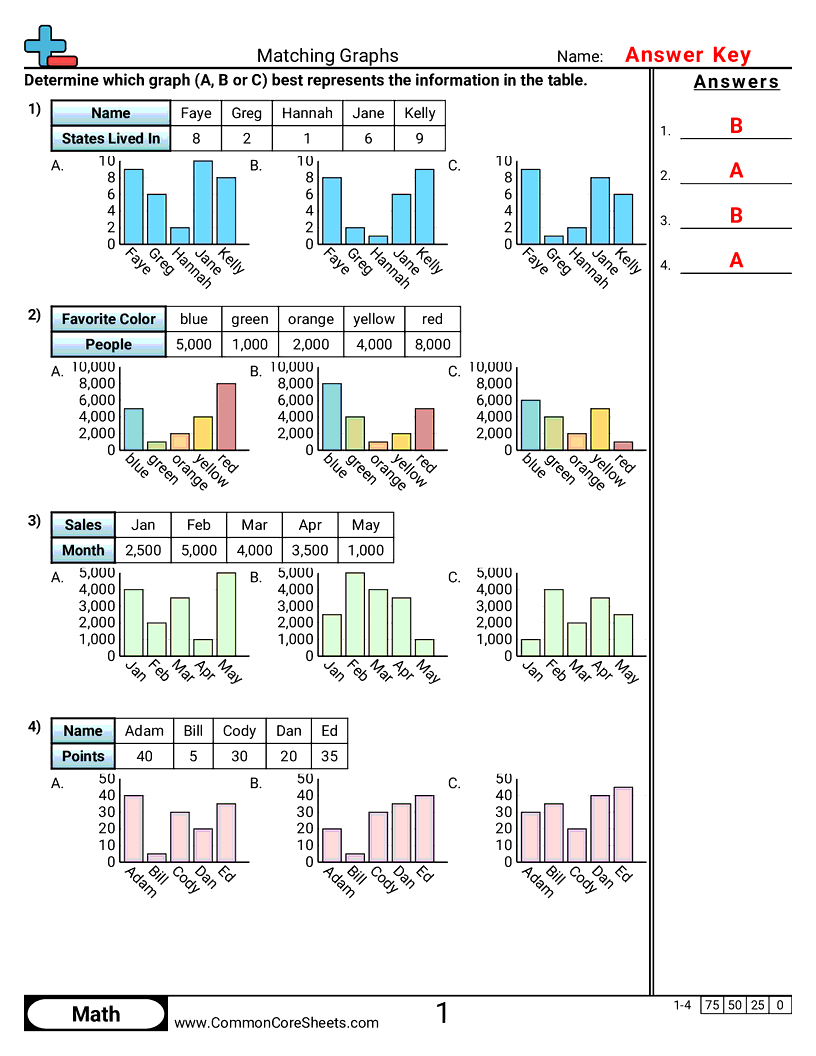
"This worksheet is designed to boost children's analytical skills in math, focusing on the concept of graph interpretation. It contains four engaging problems, asking students to match data to corresponding graphs. Each problem can be customized to align with various learning objectives. With its flexibility, it can be converted into flashcards or utilized for distance learning, promoting an effective and interactive approach to grasp and master this crucial math competency."

×
Student Goals:
Interpret and Analyze GraphsUpon successful completion of this worksheet, students should be able to accurately interpret and analyze graphical data. They will have a solid understanding of how to read different types of graphs, identifying the points on the graph and understanding what those points represent in a real-world context. From bar graphs to line charts, students will gain the ability to extract meaningful conclusions from the presented data.Critical Thinking and Problem-Solving SkillsStudents will develop their critical thinking and problem-solving skills, essential components in math and other areas of study. By analyzing data and making matches, students are actively engaged in problem-solving scenarios. These exercises require students to think critically, make decisions, and understand the consequences of these decisions, fostering cognitive growth and development.Data RepresentationLearners will acquire knowledge about data representation. They will understand how different data sets can be visually depicted through graphs. They will learn to associate values with different data categories and perceive how these values can influence the structure of the graph. This understanding will aid them in constructing their own graphs and charts in the future, a skill applicable in many academic and professional fields.Observation and Comparison SkillsThe ability to compare different graphs and observe similarities and differences is a vital skill that should be honed when completing this worksheet. Observational and comparison skills are not only essential for mathematics and statistics, but they're also valuable in everyday life. It enables students to compare different situations, make judgments, and take suitable actions accordingly.Conceptual Understanding of Mathematical IdeasThe worksheet aids in reinforcing the students' understanding of fundamental mathematical concepts. This is achieved through the practical application of these concepts to real-world scenarios. By being able to match data with its graphical representation, students will solidify their understanding of these mathematical principles, fostering future learning and comprehension.


3md3


×
Description:
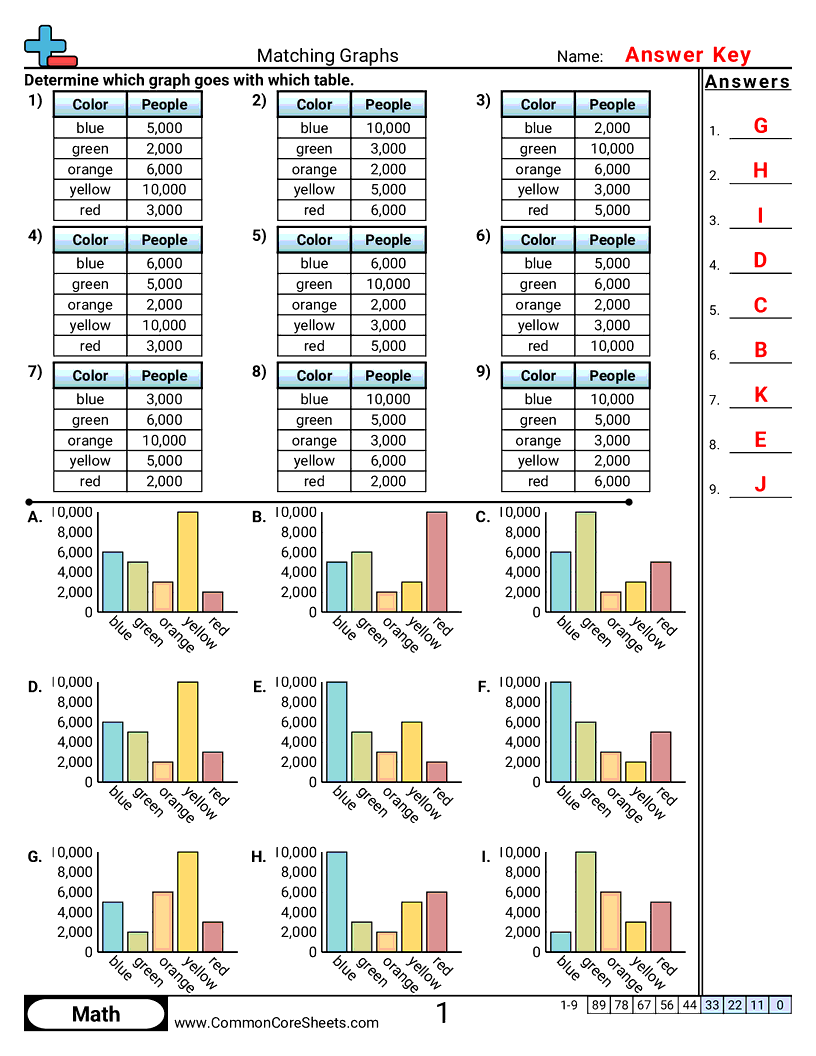
"This worksheet is designed to boost children's math skills through a series of six problems focused on Matching Graphs. Using colorful and engaging tables, each problem encourages children to discern patterns and analyze data. The worksheet can be easily customized for individual needs, converted into flash cards for hands-on learning, or utilized as a resource for distance learning. This ready-to-use educational tool promotes a fun, interactive way to master math concepts in a contemporary learning environment."

×
Student Goals:
Problem Solving SkillsUpon completing the 'Matching Graphs' worksheet, students will be able to enhance their problem-solving skills. The worksheet presents multiple problems that require students to analyze data in order to find the correct answers. This helps them to develop critical thinking and strategy development skills needed in problem-solving.Data AnalysisThe math worksheet will enable students to improve their ability to analyze and interpret data, a key mathematical skill. By working through each of the problems presented, they will have the chance to practice their data reading, comparison, and interpretation skills. Over time and with consistent practice, their comprehension and speedy interpretation of such data will improve.Understanding GraphsStudents will develop a better understanding of graphs by completing this worksheet. They will learn how to match up different sets of data and gain the ability to extract information from these graphs successfully. The ability to read and understand graphs is a crucial skill in math and science education.Attention to DetailBy precisely studying each set of data and determining the correct match, students will enhance their attention to detail. They will learn to carefully consider each piece of information before arriving at a conclusion, which is a valuable skill in many aspects of life.Accuracy and EfficiencyAs students complete the worksheet, they are likely to improve their accuracy and efficiency in dealing with numerical data. They will become more adept at recognizing patterns and making correct decisions quickly. This will boost their overall mathematical prowess and efficiency.Mathematical VocabularyThe worksheet will also help students in familiarizing with and understanding the common mathematical terms and language used in graphs and data analysis. This will enhance their mathematical vocabulary and communication, thus deepening their overall comprehension of the subject.


3md3


×
Description:
This worksheet is designed to educate kids about reading bar graphs through engaging math problems. It features 10 problems, asking them to compare and analyze data represented in graphs. Perfect for distance learning, this versatile resource can be customized to suit individual learning needs and even converted into flash cards for more interactive study sessions.

×
Student Goals:
Understanding Bar GraphsStudents will gain a thorough understanding of bar graphs. They will be capable to identify different features of a bar graph and comprehend the significance of each. Through comparison, they will be able to spot differences and similarities between various data points.Analytical SkillsCompleting this worksheet will enhance students' analytical skills. They'll become proficient in examining and interpreting bar graphs. They will learn to pose and answer questions based on the information presented on the graph, fostering their critical thinking ability.Application of Mathematical ConceptsStudents will demonstrate the application of mathematical concepts in interpreting data. They'll be able to articulate specific numerical data points from the graph and perform basic arithmetic manipulations like counting, adding, subtracting or even identifying greater or lesser values.Data InterpretationStudents will improve their skills in data interpretation, a necessary skill in today's data-driven world. They will learn how to convert data from a graphical representation into understandable insights. This could be as simple as identifying which station had the most ads, as well as more complex insights like the total number of ads across all stations.Problem-solving SkillsThe worksheet will strengthen students' problem-solving skills by providing complex challenges that require thoughtful solutions. By practicing, students will better understand how to break down a problem into its constituent parts and approach its solution logically.Communication of DataStudents will learn how to effectively communicate information derived from a bar graph. This worksheet will help them learn to turn data observed visually on a graph into coherent verbal or written responses. Such skills are critical in fields that revolve around the interpretation and communication of data.


