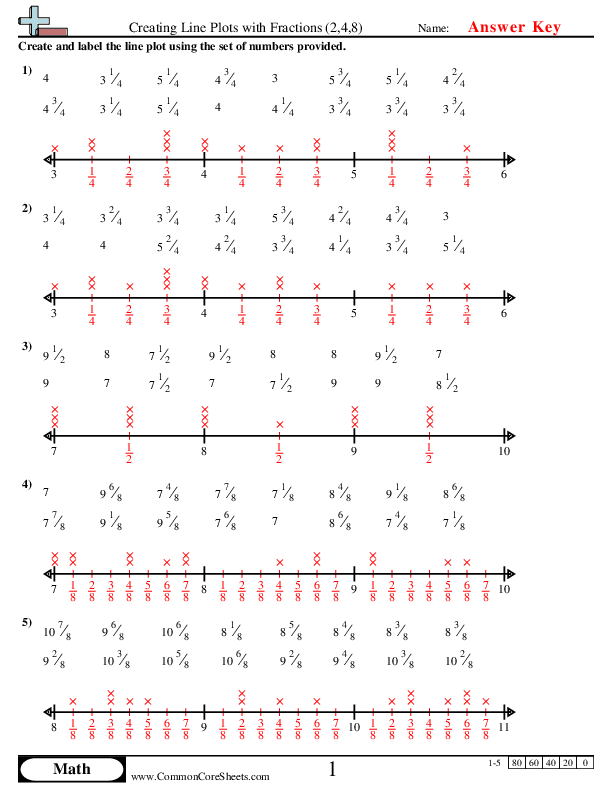
If you're looking for the best line plot worksheets on the internet, you've come to the right place! Our free line plot worksheets are perfect for students of all ages and skill levels. These worksheets cover everything from basic line plots to more advanced topics like double line plots and missing data. With our line plot worksheets, your students will learn how to interpret and create line plots, analyze data, and make predictions based on their findings. Whether you're a teacher looking for a new way to introduce line plots to your class or a student looking to reinforce your understanding of this important concept, these line plot worksheets are sure to be a valuable resource. So why wait? Start using our line plot worksheets today and watch your students' skills and confidence grow!
×

Creating Line Plots with Fractions (2,4,8)
4md4


×
Description:
"This worksheet is designed to help children improve their understanding of fractions via line plot creation. It features five engaging math problems to foster critical thinking skills. This customizable tool can be easily converted into flashcards for individual study, or integrated into any distance learning curriculum to add an interactive element to math lessons. Ideal for developing competency in fractions, this worksheet serves as a comprehensive resource for active learning."

×
Student Goals:
Fraction UnderstandingUpon completion of this worksheet, students will have developed a robust understanding of fractions. They will not just be acquainted with the basics of fractions, but experience a more profound comprehension, including the concepts of numerator and denominator. They will learn to identify fractions by carefully examining the values above and below the fraction bar. Additionally, students should have an improved knowledge of equivalence and simplification of fractions where they recognize that different fractions can represent the same value.Line Plots CreationStudents will acquire the skill of creating line plots. Line plots offer a visual representation of data using fractions and provide comprehensive information about data distribution. Students will develop competency in interpreting data from line plots, including the identification of clusters, peaks, gaps, and outliers. They will also improve in their analytical skills as line plots inspire them to ask deeper, more considered questions about the given data.Analytical SkillsCompleting this worksheet will aid students in honing their analytical abilities. The necessity to identify relevant information and the correlation between varied data points on the line plots, will cultivate their problem-solving skills. They will move a step farther from being simple calculators to becoming analytical thinkers, articulating more complex comparisons and pulling useful information from data sets.Real-world ApplicationsBy working through the problems in the worksheet, students will gain an increased understanding of how math, especially fractions and line plots, applies to real-world situations. This application-based understanding can make math more engaging for learners. It emphasizes the relevance of the subject, fostering continual interest and promoting the application of their mathematical skills in real-life scenarios.Increased ConfidenceAfter the successful completion of the worksheet, students will experience an increase in their confidence in handling fractions and line plots. This growth in confidence is not merely about their increased ability to solve such math problems, but also their fortified belief in their math capabilities. Overcoming challenges encountered within the worksheet will further foster resilience when faced with more complex mathematical problems in the future.


